Gathering deep insights into communities from advanced data science methods and geospatial analytics
Public health officials at the federal and state levels have called for a better way to measure, predict, and adjust for social factors in health care and population health. The RTI RarityTM project takes an “artificially intelligent” approach to inform decisions concerning community-level social, behavioral, environmental, and economic factors for quality health care. By curating a national database of more than 200 area-level social determinants of health (SDoH) measures within ten domains at the Census tract, ZIP code, and county levels across the U.S., RTI Rarity™ provides high-resolution insights into factors that strongly influence health outcomes.
The health data come from publicly available federal, state, and nonprofit/academic resources, including the American Community Survey, USDA’s Food Environment Atlas, CDC’s Wide-ranging ONline Data for Epidemiologic Research (WONDER), HUD, Child Opportunity Index, Opportunity Atlas, and more.
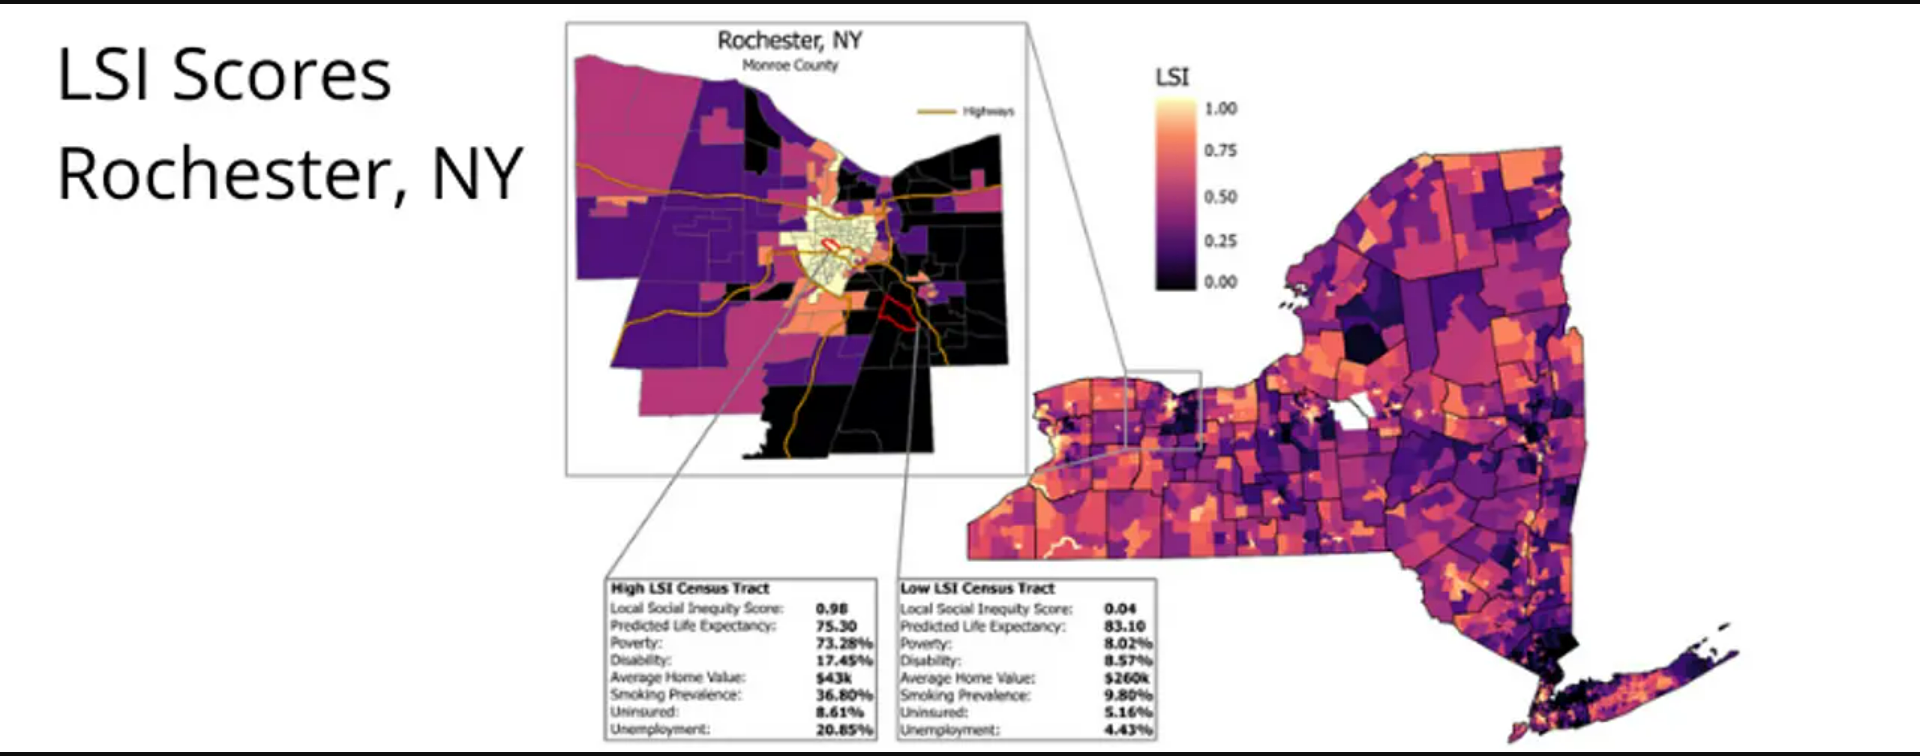
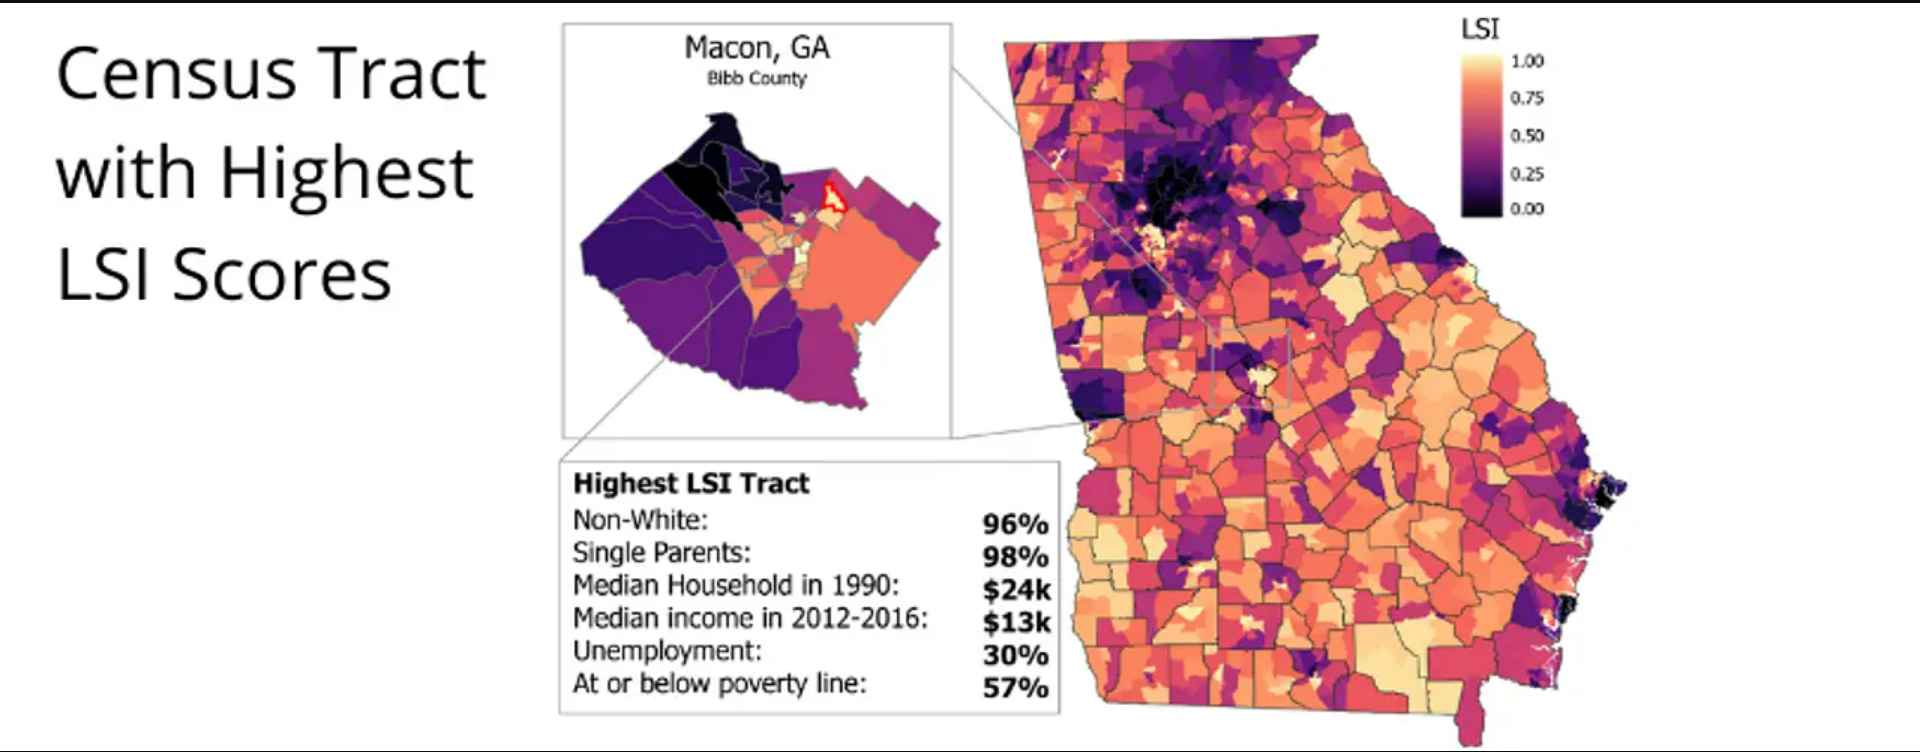
RTI Rarity™ uses supervised machine learning, including random forests and other state-of-the-art predictive methods, to create local social inequity (LSI) scores drawing on the SDoH measures. The health equity analysis tool and its underlying data allow for the development of both within-state and cross-state summary scores and ten domain-specific sub scores informed by our conceptual framework. The scores yield meaningful insights into the neighborhood-level factors driving local health outcomes.
The Impact of LSI Scores on Health Equity
We have benchmarked the LSI scores against three existing area-based composite measures related to SDoH: the Area Deprivation Index (ADI), the Social Deprivation Index (SDI), and the Social Vulnerability Index (SVI). In terms of life expectancy at birth, the LSI leads in explaining 67% of the variance across the US, whereas the SVI only explains 26%, the SDI explains 29%, and the ADI explains 43%. In other words, the LSI measure accounts for substantially more of the disparity between the neighborhoods with the highest and lowest life expectancies across the U.S.
The RTI Rarity™ LSI scores can also be linked with individual-level data to improve predictions of individual outcomes. In population-based analyses, these scores can be used to:
- understand the impact of health care innovations, payment models, and interventions on SDoH in high-risk communities;
- identify neighborhoods and areas at highest risk of poor outcomes for better targeting of interventions and resources;
- account for factors outside of providers’ control for more fair and equitable performance/quality measurement and reimbursement.
Improving Health Equity and Outcomes via RTI Rarity™ LSI Scores
With the data LSI scores provide, organizations can draw insights to inform factors that can strongly influence and improve health outcomes. RTI Rarity merges AI and data science in a risk adjustment framework with high-resolution SDoH data, all through a health equity lens. We aim to provide the local context that will enable the healthcare system to better account for, and address, SDoH across the life course.